
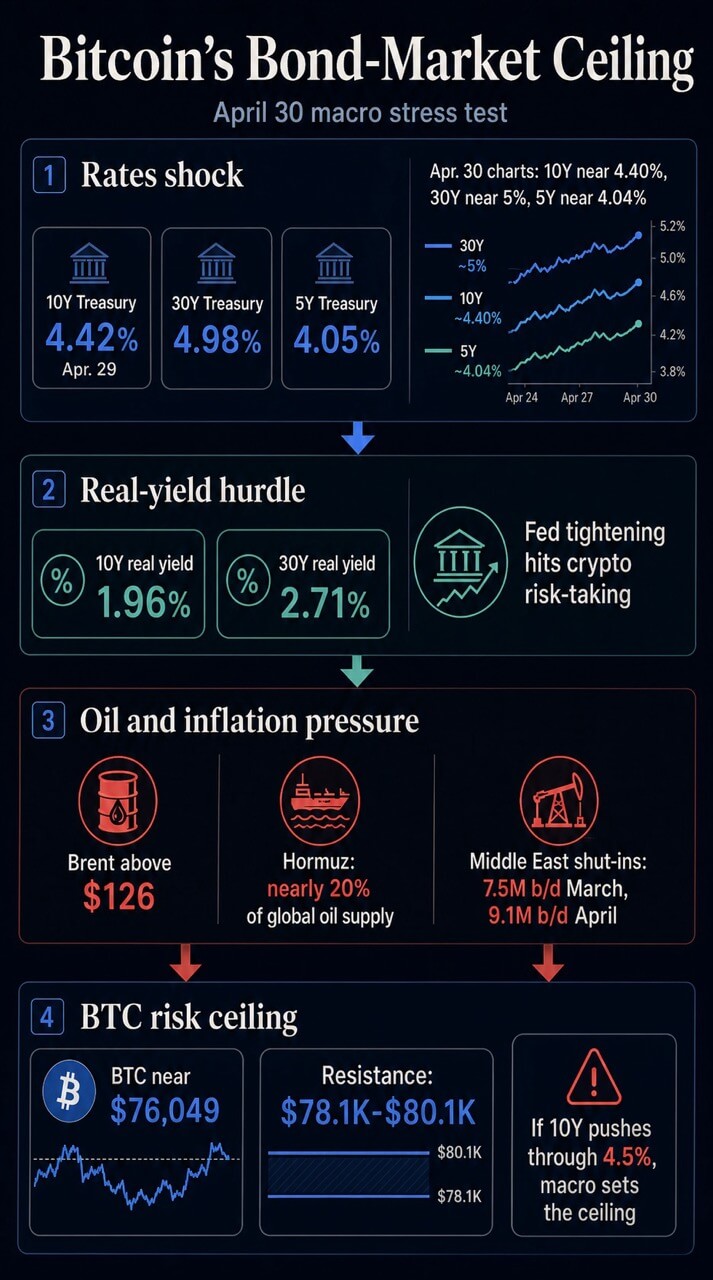
Bitcoin’s April rebound is now facing a two-front macro test. The official Treasury curve for Apr. 29 placed the 10-year yield at 4.42%, the 30-year at 4.98%, and the 5-year at 4.05%.
Today, market charts show the same pressure zone, with the 10-year near 4.40%, the 30-year near 5%, the 5-year near 4.04%, and WTI crude elevated.
At the same time, Brent crude is trading above $126, its highest level since 2022, after fresh reporting says President Donald Trump is willing to keep the Iran blockade in place for months.
Bitcoin is trading near $76,049 today, about 40% below its October 2025 high. The broader crypto market is near $2.54 trillion, with Bitcoin dominance near 59.9%.
Those levels put Bitcoin in a different kind of test. The decisive issue is whether the rate market is raising the price of taking risk faster than crypto demand can absorb it.
If the 10-year yield moves toward or through 4.5%, Bitcoin’s near-term ceiling may be set by oil, Treasury supply, real yields, and Fed liquidity operations before it is set by crypto-specific flow.
The market question is direct: if bonds keep selling off, does Washington need to reduce geopolitical oil pressure or ease Treasury and Fed plumbing before Bitcoin can retake risk appetite?
Bond yields are setting the first line
The first pressure point is the nominal Treasury curve. A 10-year yield around 4.4% is already close to the level CryptoSlate highlighted in its recent Bitcoin bond-market analysis as the area where the $80,000 test becomes harder.

The Apr. 28 analysis argued that a break above 4.35%, moving toward a 4.6% upside area, could turn a renewed inflow streak into another failed rally at resistance.
The Apr. 29 official curve put that risk within reach. The 10-year was at 4.42%, the 30-year was at 4.98%, and the 5-year was at 4.05%.
The long end is the part of the curve that speaks most directly to duration risk, equity multiples, mortgage pressure, and the discount rate investors apply to assets with distant or uncertain cash flows.
Bitcoin has no coupon, dividend, or earnings stream. That means its macro case relies heavily on liquidity, risk appetite, scarcity demand, ETF access, and balance-sheet demand.
When Treasury yields rise, those inputs face a tougher comparison. Investors can earn close to 5% at the long end of the U.S. risk-free curve while Bitcoin remains below its early-year highs.
The real-yield layer makes the setup sharper. Treasury’s real curve showed the 10-year real yield at 1.96% and the 30-year real yield at 2.71% on Apr. 29.
Treasury publishes those rates as market data. The Bitcoin implication comes from the way BTC has traded in this regime.
IMF research on the crypto cycle and U.S. monetary policy found that a common crypto factor explained 80% of crypto price variation and that Fed tightening reduced that factor through the risk-taking channel.
CryptoSlate has also argued that Bitcoin’s recent macro identity looks more like a liquidity-sensitive tech beta than a clean gold or dollar hedge.
In that regime, higher real yields can work like a drag on the market’s willingness to pay for volatility. BTC can still rise, but it needs stronger proof that demand is deep enough to survive a higher hurdle rate.
Oil has become a rates variable
The second pressure point is oil. Reuters reported that the U.S. was seeking international support to reopen the Strait of Hormuz while crude prices surged and a U.S. blockade of Iranian oil exports remained part of the pressure campaign in stalled talks.
The Guardian then reported Brent above $126 after Trump warned the blockade could last for months.
That takes the issue beyond foreign-policy risk. Oil is now part of the rate equation because energy prices flow into inflation expectations, headline inflation, freight, input costs, consumer pressure, and the Fed’s reaction function.
The Energy Information Administration’s April outlook gives the scale. It said the Strait of Hormuz had been effectively closed to shipping since Feb. 28 and that nearly 20% of global oil supply normally flows through the strait.
Brent had already reached almost $128 on Apr. 2. EIA expected Brent to average $115 in the second quarter under assumptions that included the conflict easing after April.
A separate EIA release estimated that Middle East producers shut in 7.5 million barrels per day in March, rising to 9.1 million barrels per day in April.
That forecast already treated the disruption as a major energy-market event. The latest developments on a months-long blockade challenge the duration assumption underlying that base case.
The Fed has already connected the dots. Its Apr. 29 statement said inflation was elevated, in part because of increases in global energy prices, and that Middle East developments were creating high uncertainty.
Chair Jerome Powell’s opening statement went further, noting that March PCE estimates pointed to 3.5% headline inflation and 3.2% core PCE, with headline inflation boosted by global oil prices.
The vote showed that the Fed’s constraint was both internal and external. The FOMC held the target range at 3.50% to 3.75%.
Stephen Miran dissented in favor of a 25-basis-point cut. Beth Hammack, Neel Kashkari, and Lorie Logan supported the hold but opposed keeping the easing-bias language in the statement.
That split is the rates-market version of the oil shock. One side saw enough downside risk to prefer a cut. Another side saw enough inflation risk to resist easing language. Bitcoin sits downstream from that disagreement.
Policy levers start with plumbing
If yields keep climbing, Washington has only a few near-term channels to ease the pressure. One is geopolitical: reduce the oil shock by changing the blockade calculus or reopening a route for Gulf energy flows.
That channel would be the cleanest for risk assets because it would directly attack the inflation impulse.
Another channel is liquidity management. The Fed’s implementation note kept the administered-rate structure in place and directed the Open Market Desk to buy Treasury bills, and if needed, other Treasuries with remaining maturities of three years or less, to maintain an ample level of reserves.
That is a reserve-management tool. It can support market functioning and bank-reserve conditions while still leaving oil prices and term premium outside the direct toolset.
Treasury has its own levers. Its most recent refunding page shows the next major financing documents scheduled for May 4 and May 6.
February borrowing estimates projected $109 billion in privately held net marketable borrowing for April through June, with an assumed $900 billion end-June cash balance.
The February refunding statement said Treasury could adjust bill sizes, expected the Treasury General Account to peak around $1.025 trillion in late April, and planned buybacks of up to $38 billion for liquidity support plus up to $75 billion in the one-month to two-year bucket for cash management.
Those tools can affect market plumbing. Bill issuance changes the part of the curve that absorbs supply. Buybacks can support off-the-run liquidity.

TGA movements can add to or drain bank reserves. The constraint is that debt management can smooth financing pressure while energy inflation still pushes against the Fed.
| Path | Trigger | Rates channel | BTC implication |
|---|---|---|---|
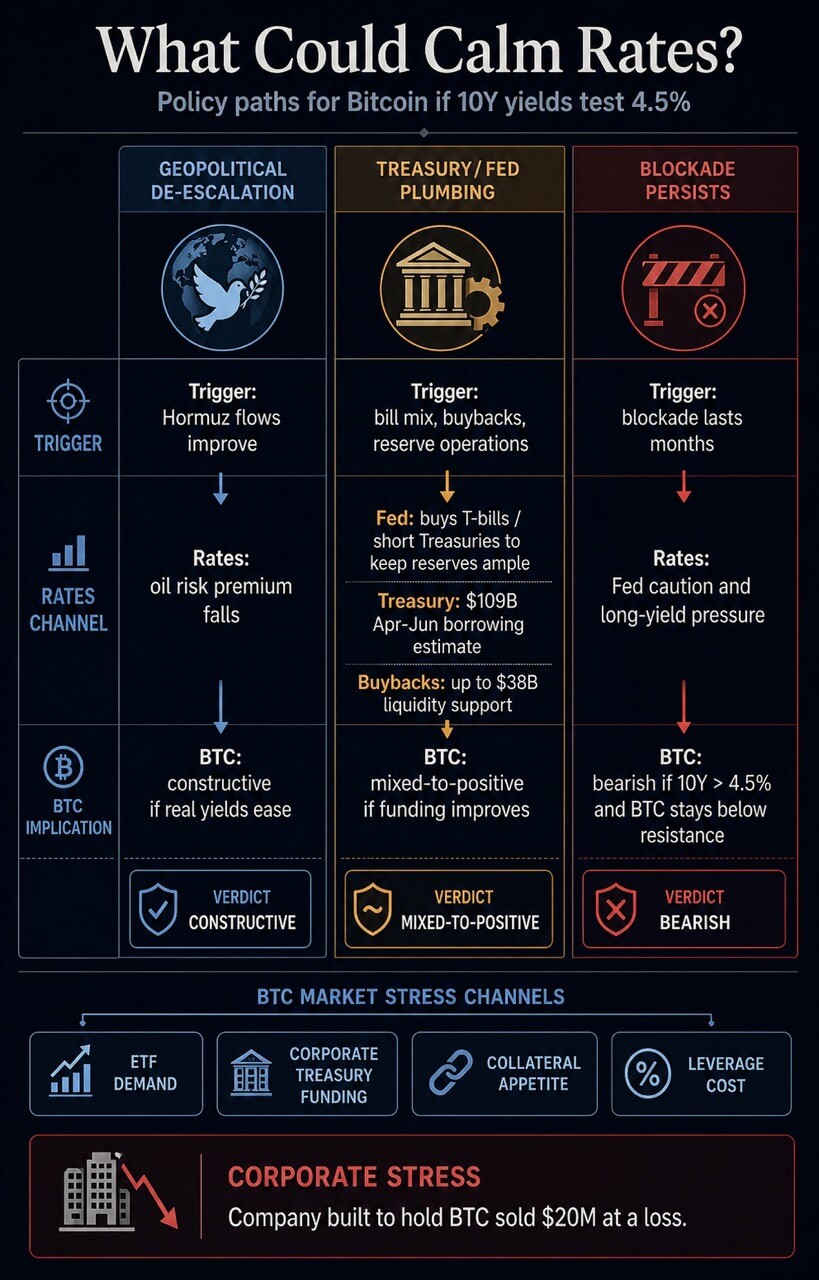
| Geopolitical de-escalation | Hormuz flows improve or blockade pressure eases | Oil risk premium falls, inflation expectations cool | Most constructive path for Bitcoin if real yields ease with it |
| Treasury/Fed plumbing relief | Bill mix, buybacks, reserve operations, or TGA changes ease funding pressure | Liquidity conditions improve while oil risk remains live | Mixed-to-positive if real yields fall; weaker if it reads as stress response |
| Blockade persists | Oil stays elevated and duration extends beyond EIA’s April assumption | Fed keeps caution, long yields stay pressured | Bearish if the 10-year moves through 4.5% and BTC stays below resistance |
| Flow-led Bitcoin rebound | Spot and ETF demand absorb short-term holder supply | Rates stay high but stop accelerating | BTC can recover, but durability still depends on bonds calming |
Each path remains conditional. A geopolitical channel would attack oil-inflation pressure directly. A plumbing channel would need to improve funding conditions without making the response look like stress.
The market still has to prove which path is active.
Bitcoin’s own market has little room
Bitcoin’s price structure makes the macro squeeze more visible. BTC fell below $76,000 after the Fed decision, and Glassnode data showed short-term holder profit-taking around the $78,000 to $79,000 area.
The same report said buyers would need to absorb overhead supply to push toward $84,000, while a break below $68,000 would expose a deeper correction path.
CryptoSlate’s Apr. 28 bond-market analysis placed the key battleground around $78,100 to $80,100. That area now works as a practical confirmation zone.
A reclaim would show that spot demand, ETF demand, or positioning can absorb the macro shock. A rejection would support the view that the bond market is still setting Bitcoin’s ceiling.
The broader liquidity context supports that caution. CryptoSlate’s Apr. 30 debt-and-liquidity analysis argued that U.S. debt is growing faster than M2 and that Treasury issuance, the Treasury General Account, reserve balances, and bank-credit conditions can keep the financial plumbing tight even as broad money rises.
A separate CryptoSlate analysis of M2 found that Bitcoin’s liquidity relationship is lagged and regime-dependent, with real yields, the dollar, ETF flows, and geopolitical shocks able to override the simple money-supply argument.
Corporate treasury demand adds another channel. CryptoSlate’s coverage of the Bitcoin treasury trade showed that corporate and sovereign holders can become sellers when funding pressure rises, debt needs increase, or cash becomes more valuable than balance-sheet optics.
A company built to accumulate BTC, selling $20 million at a loss, turned that risk into a concrete example.
That is why the current setup reaches beyond spot traders. Higher Treasury yields can pressure Bitcoin through discount rates, ETF demand, corporate treasury funding, collateral appetite, and the cost of leverage.
Oil keeps the Fed constrained. Treasury supply keeps reserves and term premium in focus. Bitcoin’s own supply zone determines how quickly those macro forces manifest in price.
Bitcoin can still rally from here. A strong enough flow bid can absorb profit-taking for a while, and prior CryptoSlate oil-war coverage showed BTC can resist crude pressure intraday when demand is present.

The problem is durability. Once U.S. equities opened in that earlier session, Bitcoin moved back into the broader risk trade.
That is the same unresolved test now. A BTC bounce below $80,000 would show that buyers remain active. A durable move through the resistance zone would require evidence that bonds, oil, or liquidity have stopped working against the trade.
The next signal sits in the 10-year yield. If it eases back from the 4.4% to 4.5% zone, Bitcoin’s demand story gets room to breathe.
If it breaks higher while oil stays elevated, BTC’s ceiling is likely to stay outside crypto. The bond market would still be deciding how much risk investors are willing to own.
Analysis,Featured,Macro#Treasury #yields #spike #highest #levels #year #adding #problem #Bitcoin #liquidity1777561202
