
Pi Network entered July 2026 at a fresh all-time low near $0.10, its most oversold reading since launch, facing a supply-and-demand collision the whole market is watching. On the supply side, 103.7 million tokens unlock this month. On the demand side, a set of Pi2Day product launches promises to create real utility for the first time. This is the levels, the collision at the center of the forecast, and the honest case on both sides for a token at its lowest ebb.
Summary
- Pi Network enters July near $0.10 as 103.7 million token unlocks threaten to increase selling pressure.
- Three Pi2Day products could create real token demand, but their impact depends on measurable user and developer adoption.
- Holding $0.10 support keeps the recovery case alive, while reclaiming $0.12 could trigger a broader rebound.
Pi Network (PI) enters July 2026 at the weakest point in its short public history, trading near $0.10 to $0.114 after setting a fresh all-time low, with momentum indicators showing the deepest oversold reading since the token began trading.
The price has fallen through support levels that held repeatedly in prior months, strung together a multi-day losing streak, and now tests the psychologically critical $0.10 line, below which lies uncharted territory. For a project that launched with enormous community expectations, the chart is a sobering picture, and the month ahead is defined by a single collision.
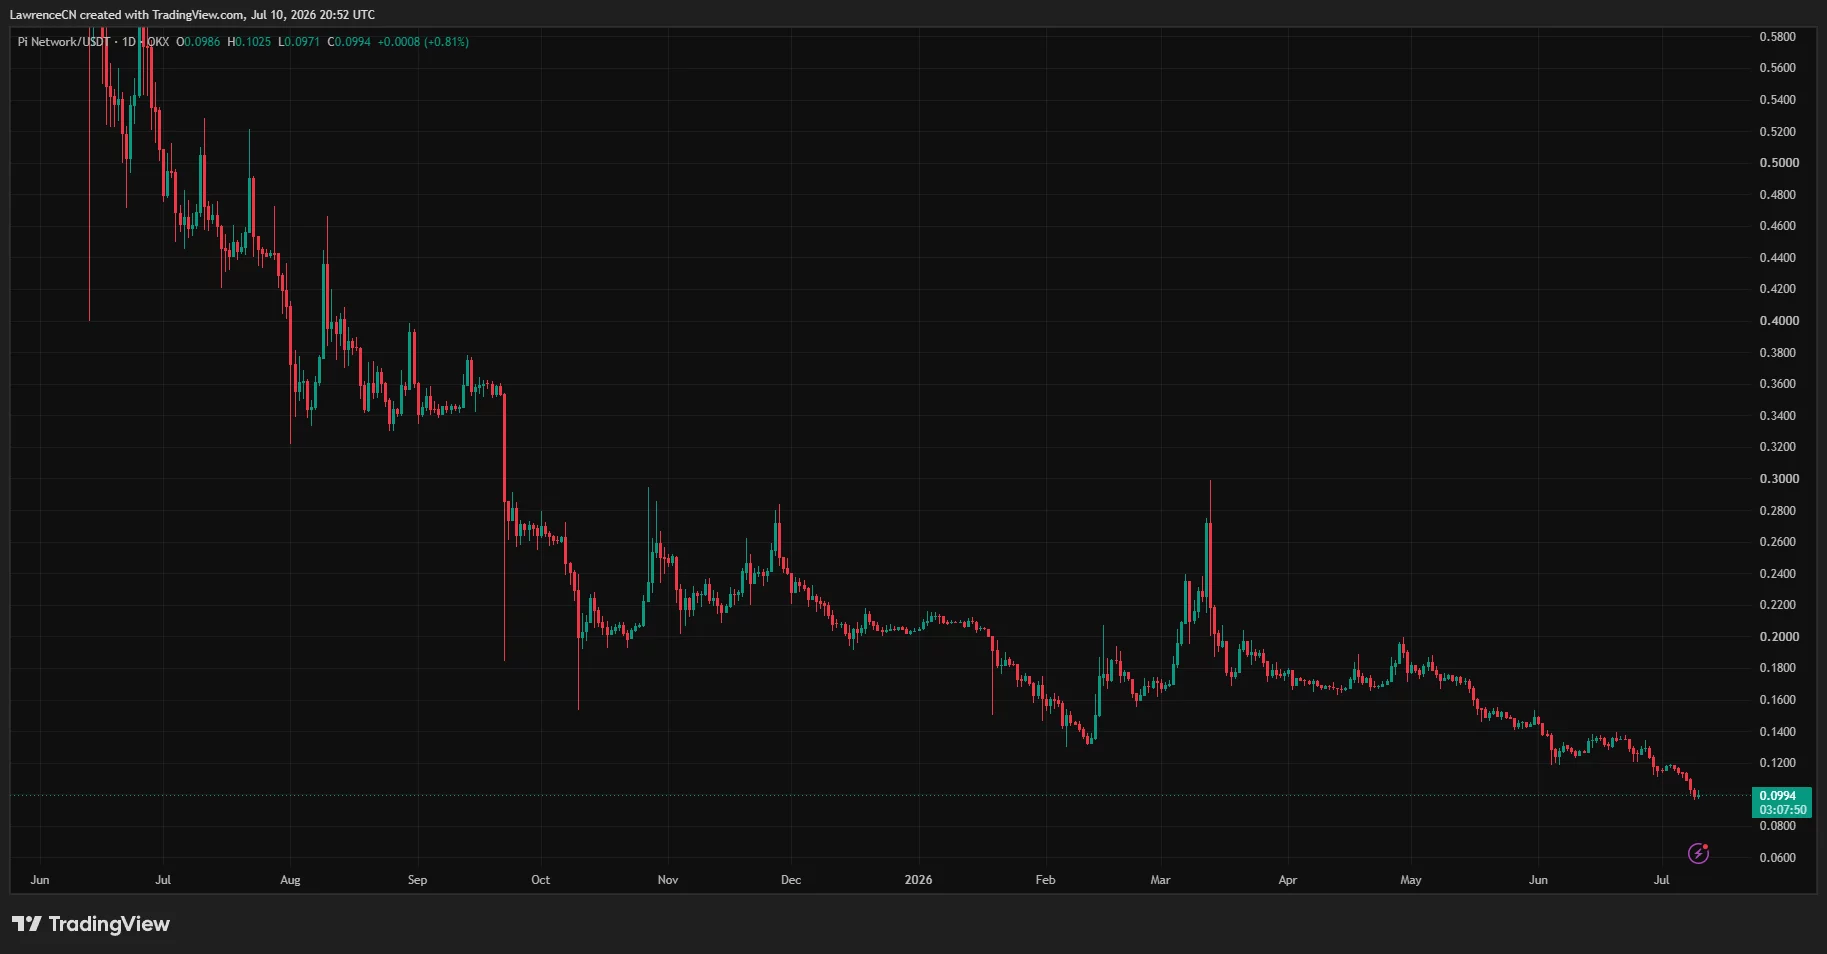
That collision is supply against demand, stated almost too cleanly. On the supply side, roughly 103.7 million PI tokens unlock in July, an increase of some 27 million over the prior month, adding fresh sellable supply to a market already struggling to find buyers, the same supply-versus-demand pressure that dragged the broader altcoin market through the first half.
On the demand side, the project has timed a set of product launches around its annual Pi2Day event, including a verification tool with a fee-in-PI model, a hosting product, and a sign-in service, each intended to create genuine token utility and, with it, genuine demand for the first time. The entire July forecast reduces to which side of that collision wins: whether the new products can manufacture demand fast enough to absorb the unlock supply, or whether the supply overwhelms the demand and pushes an already record-low token lower.
This prediction maps the collision the way a trader would: the price levels that matter now that the token is in uncharted low territory, the bearish case built on the unlock calendar and the broken trend, the bullish case built on extreme oversold conditions and the new utility, the analyst target ranges worth knowing, and the honest bottom line on a token at its lowest ebb.
None of it is investment advice; Pi’s volatility and its unusual mining-and-distribution history make it especially unpredictable, and readers should treat every number here as a scenario rather than a promise.
The levels that matter
With the token at fresh lows, the level map is unusually stark, because much of the price history that would normally provide reference points sits above the current price, leaving fewer prior floors below. Pi trades near $0.10 to $0.114, beneath the moving averages that now slope down and cap rallies, and the structure is decisively bearish on the trend even as it stretches to an oversold extreme.
On the downside, the defining level is the $0.10 psychological line, a round number the token is actively testing and whose failure would push Pi into territory it has never traded in, where the absence of prior support makes the next floor hard to define and a swift move lower more possible.
Just beneath the current price, the $0.110 area and the recently broken support that had held around $0.12 now act as the immediate reference points, with $0.12 having flipped from support to resistance after the breakdown. Losing $0.10 decisively is the bearish trigger that opens the widest downside, precisely because so little prior structure lies below it.
On the upside, reclaiming the broken $0.12 support is the bulls’ first task, and turning it back from resistance into support would be the first sign the breakdown is being repaired. Above that, the levels near $0.1228, $0.1344, and $0.1496 mark the resistance steps a recovery would have to climb, each corresponding to prior consolidation zones, and clearing them in sequence would signal the oversold bounce maturing into something more durable.
The structure, in short, is a token in a confirmed downtrend at an oversold extreme, testing a psychological floor with thin support beneath it and a staircase of resistance above, where the direction of the next significant move depends heavily on whether the month’s demand catalysts can arrest the decline.
The bearish case: the unlock calendar and the broken trend
The case for continued weakness starts with the supply calendar, because it is the most concrete force acting on the token this month. Roughly 103.7 million PI unlock in July, up about 27 million from the prior month, and every unlocked token is potential new supply entering a market that has struggled to absorb it.
Token unlocks are a scheduled, readable form of selling pressure, and when the demand side is weak, as a record-low price suggests it currently is, fresh unlock supply tends to push price down as newly liquid tokens meet insufficient buying. For a token already at all-time lows, an increase in the monthly unlock is a direct headwind, and it is the single most important bearish fact of the month.
The second bearish force is the broken trend itself. Pi has fallen through supports that held repeatedly, and a token making fresh lows beneath falling moving averages is, by definition, in a downtrend that has not yet shown a bottom, with each broken support becoming resistance on any bounce.
Sentiment has followed price down; the community enthusiasm that drove earlier interest has faded into fatigue, and the demand indicators that matter, trading activity and the appetite to hold rather than sell, have thinned. A token in this posture is vulnerable to the reflexive dynamic where falling prices beget more selling as disappointed holders exit, and the record-low price is itself a signal that this dynamic has been in control. If the July unlock supply meets this weak demand backdrop without the new products generating meaningful offsetting buying, the bearish path points toward a break of $0.10 and a move into the undefined territory below it.
Understanding the unlock: why 103.7 million matters
Because the unlock number anchors the bearish case, it is worth understanding what it represents and why the monthly figure moves, since the mechanics are specific to Pi’s unusual design. Pi’s supply was distributed over years through its mobile mining phase, during which participants accumulated tokens that remained locked, subject to release schedules tied to identity verification, holding commitments, and the network’s migration to its open mainnet. Each month, a tranche of these previously locked tokens becomes transferable, converting balances that existed but could not be sold into supply that can, and July’s tranche is roughly 103.7 million, up about 27 million from the prior month.
The increase is the part that matters for price. A larger monthly unlock means more new sellable supply arriving into the market than the month before, and unless demand grows to match, the additional supply weighs on price through simple arithmetic: more tokens available to sell, the same or less buying to absorb them.
For a token already at all-time lows, where the price itself signals that existing demand is struggling to absorb existing supply, an uptick in the unlock is a direct and quantifiable headwind. This is why the unlock calendar is the single most-watched supply metric for Pi, and why the July figure features in nearly every forecast: it is the one large, scheduled, knowable force acting against the price, and its size this month is larger than last.
The nuance the bears sometimes skip is that not all unlocked tokens sell. Unlocked supply is potential selling pressure, not guaranteed selling, and whether it actually hits the market depends on holder behavior: participants who believe in the project may hold their newly liquid tokens instead of dumping them, particularly if the new products give them a reason to use their tokens instead of selling.
This is precisely where the supply and demand sides of the collision meet, because the same products that aim to create buying demand could also reduce selling by giving holders a use for their tokens, which is why the month’s outcome is not a mechanical certainty but a genuine contest between a known supply increase and an uncertain demand response.
The pivot beneath the price: distribution to utility
The deepest way to read Pi’s July is as a test of the project’s central transition, because the token’s entire situation reflects a pivot that every large community-distributed project eventually faces. Pi spent its formative years on distribution: acquiring users through mobile mining, building one of the largest claimed user bases in crypto, tens of millions of participants, and spreading tokens widely through that process. That phase created supply and community but not, by design, much in the way of token utility, and the current price weakness is in large part the market repricing a token whose distribution vastly outran its usefulness.
The Pi2Day product launches represent the attempt to complete the other half of the arc: converting a distribution network into a utility network, where the token is used and demanded, not merely held and eventually sold. The verification product’s fee-in-PI model is the clearest expression of the strategy, because a service that requires spending PI creates a demand for PI that exists independent of speculation, the kind of structural, recurring buying that could, at sufficient scale, offset the unlock supply permanently instead of temporarily. The hosting and sign-in products extend the same logic into developer and application use cases. Whether this pivot succeeds is the question that dwarfs any single month’s price action, and July is significant precisely because it is the first real test of the strategy at the moment the token most needs it to work.
The honest assessment is that pivots like this are hard and most are gradual, so a single month of product launches is unlikely to fully resolve a supply overhang built over years, even in the bullish case. What July can realistically deliver is evidence, early adoption data showing whether the products attract genuine usage and generate real fee demand, and that evidence, more than the price itself, is what will indicate whether the pivot is working. A token can remain weak on price while its underlying utility begins to build, and the disciplined reader watches the adoption metrics beneath the price for the leading signal, because in a distribution-to-utility pivot, usage turns before price does, if it turns at all.
The bullish case: extreme oversold and new utility
The case for a bounce, or a bottom, rests on two pillars. The first is the extreme oversold condition, which is the strongest technical argument in the bulls’ favor. Pi’s momentum indicators sit at their most oversold since the token launched, a reading that historically precedes relief rallies because it reflects selling exhaustion, the point at which the sellers who wanted out have largely left and even modest buying can produce a sharp bounce. Oversold conditions do not guarantee a reversal; a token can stay oversold as it grinds lower, but they do mean the conditions for a snapback are present, and an oversold bounce from here could carry toward the $0.1228 and $0.1344 resistance levels quickly if any catalyst sparks it.
The second pillar is the demand catalyst the bears’ analysis leaves out: the Pi2Day product launches. The project has timed a set of releases around its annual event, and the most significant for token demand is a verification product built on a fee-in-PI model, meaning users pay for the service in PI, creating direct, recurring token demand instead of the speculative demand that has dominated the token’s history.
Alongside it, a hosting product and a sign-in service aim to extend Pi’s utility into real applications. If these products gain adoption, they represent the first genuine demand-side counterweight to the relentless unlock supply, the kind of fee-driven token sink that gives a token a use beyond speculation. The bullish thesis is that the timing is deliberate, the project is answering its supply overhang with utility precisely when the token is most oversold, a supply cliff of the kind that has stress-tested far larger tokens, and if the products deliver, the combination of selling exhaustion and new demand could mark a bottom near the lows. This is the pivot the entire project has pointed toward: from a mining-and-distribution phase that created supply to a utility phase that must create demand, and July is its first real test.
Three scenarios for July
The supply-demand collision produces three coherent paths, organized around the $0.10 floor and the demand response.
The bearish scenario is the unlock winning. If the 103.7 million tokens meet weak demand and the new products fail to generate meaningful early adoption, the selling pressure pushes Pi through the $0.10 psychological floor into the undefined territory below, where thin prior structure makes the decline hard to arrest and a swift move lower possible. A weak broader crypto tape would reinforce this path. It is the default if demand does not answer the supply.
The base case is a grind near the lows. Pi holds around the $0.10 to $0.12 zone, defending the psychological line on dips and stalling beneath the broken $0.12 support on bounces, as the unlocked supply and whatever demand the products generate roughly offset each other. In this path, the token consolidates at its lows while the market waits for clearer adoption evidence, neither breaking down decisively nor recovering, the most likely outcome if the product launches show promise but not yet scale.
The bullish scenario is oversold plus utility. Selling exhaustion at the most oversold reading since launch combines with genuine early adoption of the Pi2Day products to spark a relief rally, reclaiming the $0.12 support and climbing the $0.1228 to $0.1496 resistance staircase, with the move amplified by the thin float and any short-covering. This path requires the demand catalysts to actually deliver measurable usage, and it is the one the project has engineered toward, arriving at the moment of maximum oversold potential.
The targets on the table
Forecasts for Pi span a wide range and deserve extra caution, because the token’s short history, unusual distribution, and thin prior structure make confident prediction especially difficult. Short-term technical projections cluster around the levels named above: a downside case that breaks $0.10 and explores the territory below, against a recovery case that reclaims $0.12 and climbs toward the $0.1228 to $0.1496 resistance band on an oversold bounce or a successful product launch.
Analyst and forecasting-service targets for the month vary widely, from bearish projections extending the decline below the psychological floor to more optimistic scenarios in which the oversold condition and the Pi2Day catalysts drive a rebound toward the mid-teens in cents, with the widest bull cases requiring both a market-wide recovery and demonstrable product adoption to justify.
The honest reading of the target spread is that it maps directly onto the supply-demand collision at the heart of the month: the bearish targets assume the unlock supply dominates and the products underdeliver, while the bullish targets assume the oversold bounce and the new utility combine to arrest the decline.
For July specifically, the levels matter more than any single price target, with the $0.10 floor and the $0.12 reclaim as the two lines whose behavior will signal which side of the collision is winning. Given the token’s volatility and its record-low, thinly-supported position, the range of plausible outcomes is genuinely wide, and the disclaimer at the end of this piece carries more weight than usual.
What to watch as the month unfolds
For a reader tracking Pi through July, the signals divide cleanly into the two sides of the collision, and most are observable. On the supply side, the unlock’s actual market impact is the thing to watch: whether the 103.7 million tokens visibly pressure the price as they become liquid, or whether holders absorb them by holding instead of selling, which would show up as the price stabilizing despite the increased supply. Exchange inflows, tokens moving to venues where they can be sold, are the on-chain tell that unlocked supply is heading for the market instead of staying in wallets.
On the demand side, the product-adoption metrics are the leading indicator, and they matter more than the price itself. The specific things worth watching are whether the verification product attracts real users, whether its fee-in-PI model generates measurable, recurring token demand, and whether the hosting and sign-in products find developer and application uptake.
Announcements are not adoption; the signal is usage, and early usage data, however small, is the clearest evidence of whether the pivot is beginning to work. Above the two sides, the $0.10 psychological floor is the single price level whose behavior summarizes the contest: its defense keeps the bottoming thesis alive, and its decisive failure confirms that supply is winning.
Two context factors round out the dashboard. The broader crypto market, driven by the same macro forces weighing on the majors, is a backdrop that can lift or sink Pi regardless of its own supply-demand balance, since a token at all-time lows is especially vulnerable to a weak tape.
And sentiment, measurable in community activity and trading interest, is worth watching as a contrarian signal, because extreme pessimism at an extreme oversold reading is historically the environment from which sharp reversals begin, if a catalyst arrives to spark them. A reader watching the unlock’s impact, the adoption data, the $0.10 line, and the market backdrop has the full picture, and is positioned to read the collision’s outcome as it resolves instead of guessing at it in advance.
The honest bottom line
Pi Network’s July 2026 is a supply-demand collision at the worst possible moment for the token and, arguably, the most interesting one. On one side, 103.7 million tokens unlock into a market already at all-time lows with faded sentiment and a broken trend, a concrete and substantial supply headwind.
On the other, a set of product launches timed to the project’s annual event promises, for the first time, real token utility and fee-driven demand, arriving precisely when the token is at its most oversold reading since launch. The month’s direction depends on which force proves stronger, and the token’s thin structure beneath the $0.10 line means the downside is undefined while the oversold condition means the upside could be sharp if a catalyst lands.
The single most useful thing to watch is the interaction between the two forces: whether the Pi2Day products show real adoption, measured in actual usage and fee-driven token demand rather than announcements, and whether that demand is enough to absorb the unlock supply. The $0.10 line is the number that matters, its defense keeping the bottoming thesis alive and its failure confirming the bears.
Pi enters the month at its lowest and most oversold, which is simultaneously the most dangerous position, thin support below, and the position from which the sharpest recoveries historically begin, if demand arrives. Whether the project’s pivot from distribution to utility delivers that demand in time is July’s question, and honestly, the adoption data and the unlock’s market impact, not any forecast, will answer it.
A final word on holding perspective at a moment like this, because a token at all-time lows generates strong emotions that cloud analysis in both directions. The bearish extreme reads the record low and the rising unlock as proof the project is failing, and the bullish extreme reads the oversold bounce potential and the new products as proof a reversal is imminent, and both are overconfident. The honest position sits between them: Pi faces a real, quantifiable supply headwind this month, and it is simultaneously attempting a real, potentially meaningful pivot to utility at the point of maximum oversold pressure, and the outcome depends on adoption data that does not yet exist.
Neither the doom case nor the moon case is supported by what is actually knowable today, and the discipline the situation rewards is patience with the evidence, watching the unlock’s impact and the product uptake accumulate through the month instead of committing to a narrative before the data arrives.
For a project whose entire thesis now rests on converting an enormous user base into genuine token demand, July is the first chapter of the test, not the verdict, and the most useful stance is to read it honestly, as it is written, one week of evidence at a time.
Pi arrives at July carrying both the largest community in its category and the lowest price in its history, a contradiction that is itself the story: distribution succeeded, valuation did not, and the gap between them is exactly what the utility pivot must now close. The month will not close it alone, but it will show whether the closing has begun.
Disclaimer: This article is for informational purposes only and does not constitute investment advice. Cryptocurrency markets are highly volatile, and you can lose your entire investment; Pi Network in particular carries elevated uncertainty given its short trading history and unusual distribution. Price levels, unlock figures, and product timelines reflect information current as of July 9, 2026, and are subject to change; verify current conditions before making any decision. Always do your own research.
Markets#Network #price #prediction #July #Unlocks #utility1783719018